Visceral Fat Accumulation and Estrogen Decline
Why belly fat expands even when weight stays the same.
A woman in her late forties tells her doctor that her clothes fit differently, that her waist has thickened even though the scale reads about the same as it did two years ago. She is told this is normal, that this is just what happens with age. That answer is incomplete, and it is the starting point for this piece. Visceral fat accumulation during perimenopause has a specific hormonal cause tied to the hormonal transition itself, rather than to the passage of years or to eating more than the body needs. Treating the two as the same thing leads women to misread their own bodies and to apply the wrong fix to a problem that has a precise biological origin.
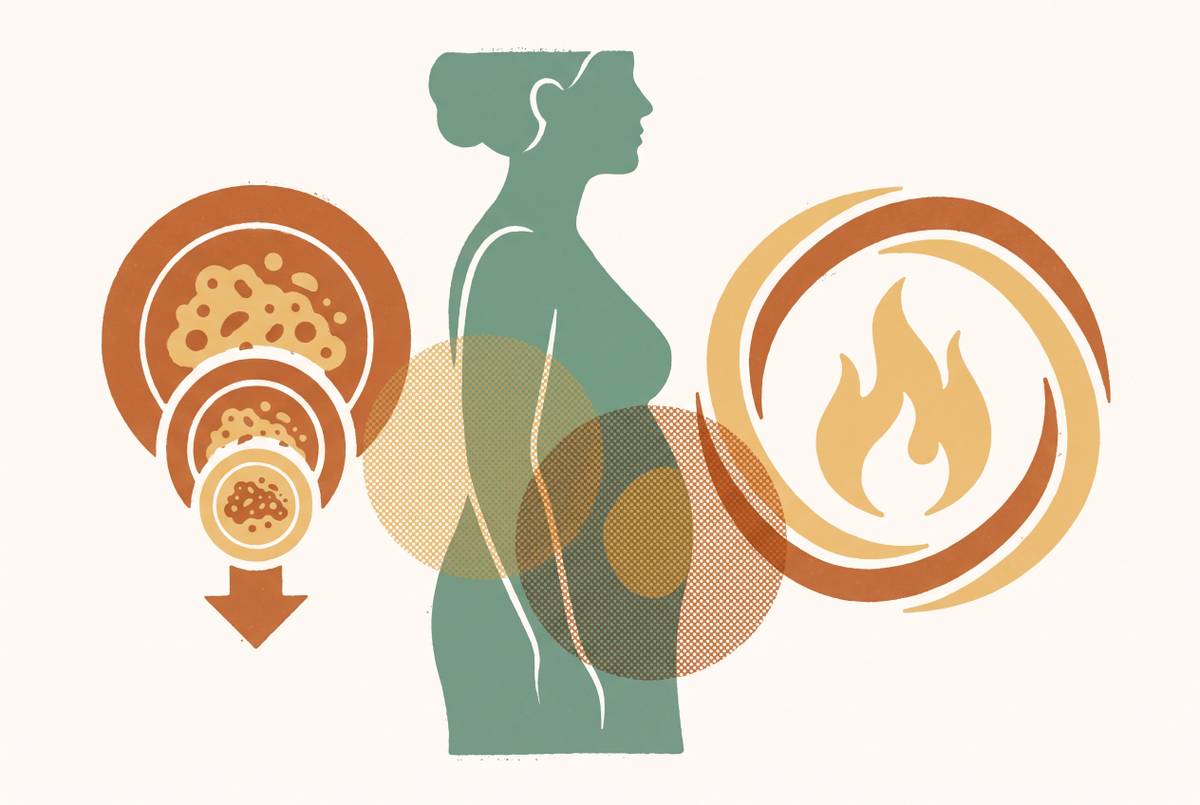
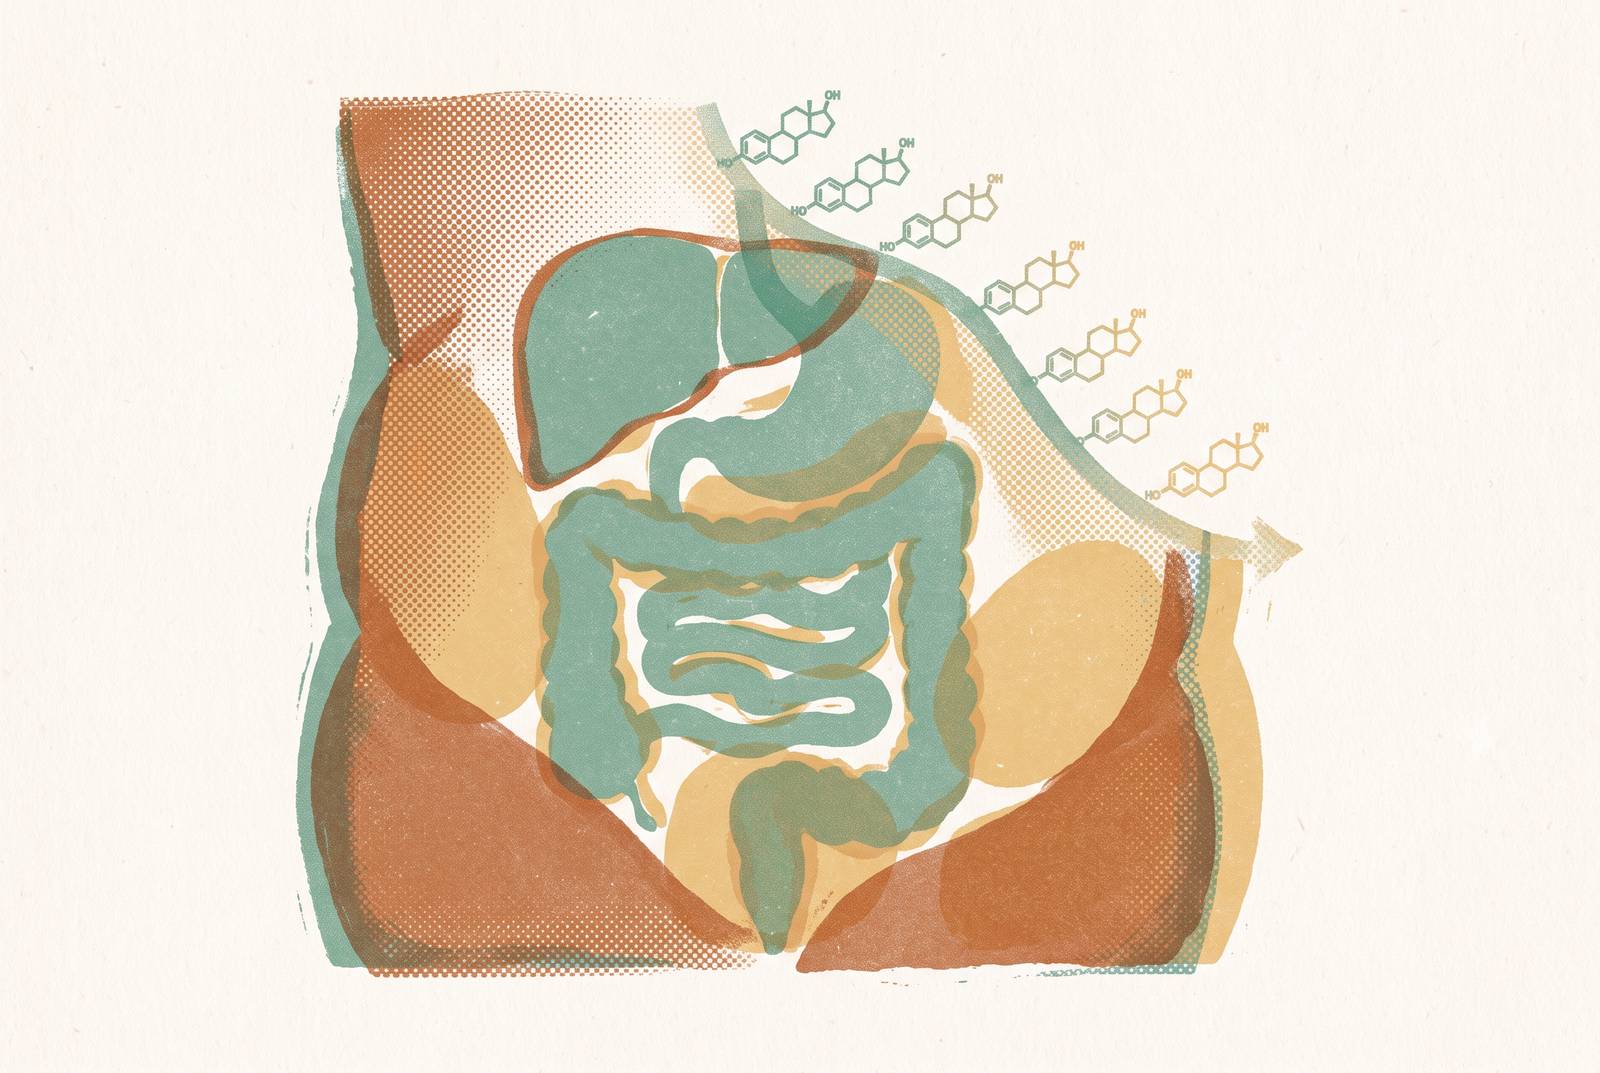
The pattern clinicians who treat perimenopausal patients describe is strikingly consistent: scale weight holds steady, but the waist expands, clothes fit worse, and blood markers for cholesterol and blood sugar start moving in a direction nobody wants. What ties these threads together is the body moving fat from one place to another, shifting stores away from the hips, thighs, and buttocks (the subcutaneous gluteofemoral depots) and toward visceral adipose tissue packed around the liver, pancreas, intestines, and heart. This kind of redistribution can happen even when total body weight barely budges, and that is precisely why it slips past routine checkups built around the number on the scale.
The two hormonal pathways that redirect fat storage toward visceral depots
Two separate biological pathways, not one blanket hormonal decline, do the work of pushing fat toward visceral storage. Both trace back to falling estrogen, but they act through different mechanisms, and understanding them separately helps explain why the shift in fat storage is so consistent across women going through this transition.
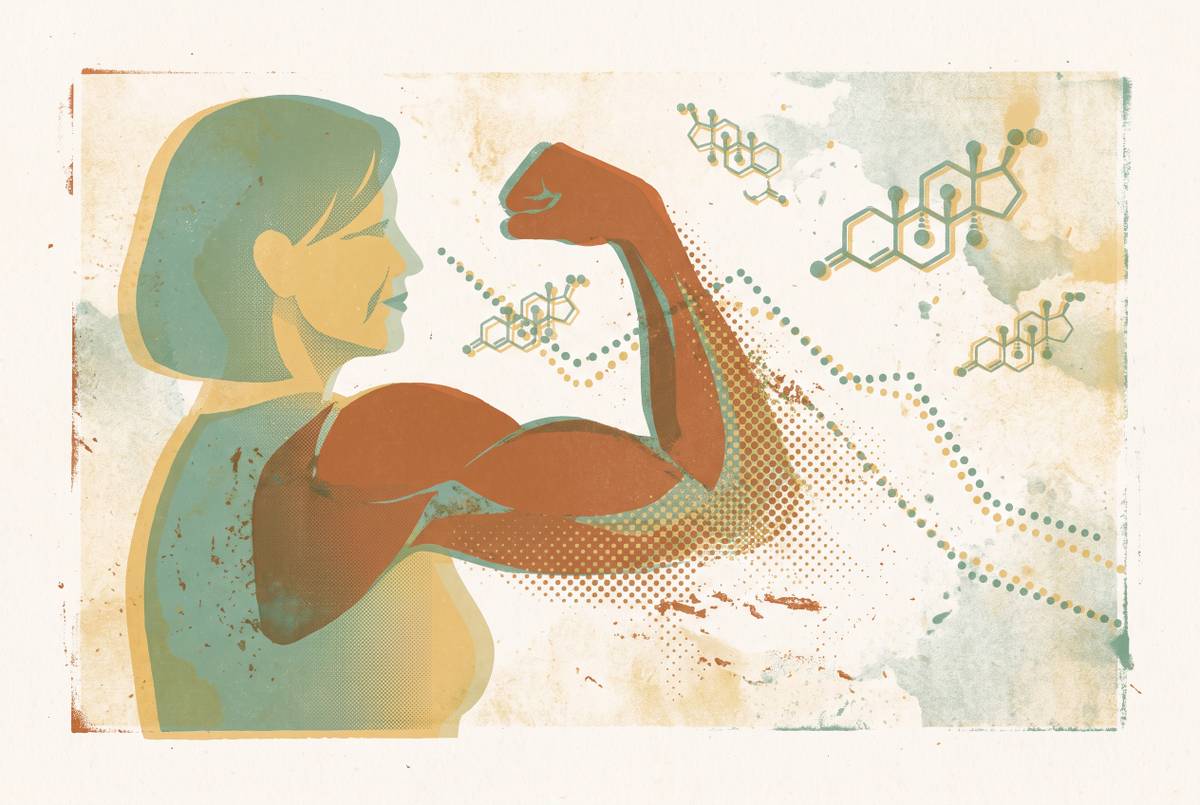
The first pathway runs through bone marrow. When estrogen drops, the bone marrow makes more fat cells, and these adipocytes are linked specifically to visceral fat expansion and to impaired function in the surrounding tissue. The second pathway involves the balance between estrogen and androgens, the hormones more typically associated with male physiology. As estrogen drops, the ratio tips toward relative androgen excess, and that shift alone favors fat storage in visceral depots, so fat distribution starts to look more like what you typically see in men.
During the reproductive years, estrogen actively steers fat storage toward the hips and thighs. This is why fat distribution differs so visibly between men and women of reproductive age. As estrogen output weakens through perimenopause, that steering function loses its grip, and the body's default setting shifts toward central, visceral storage. This shift is documented in a 2026 review in the American Journal of Preventive Cardiology, led by Manning, Stockman, and Zanni. The same review found that women with only minimal to modest weight gain during perimenopause still showed measurable expansion of visceral fat, and some showed a reduction in subcutaneous fat around the hips and thighs. The redistribution, in other words, does not wait for the scale to move.
One might ask why two separate mechanisms would be necessary to explain a single outcome. The answer may be that redundancy itself is the point: a body undergoing hormonal decline will experience this redirection of fat storage through more than one route, making the overall effect harder to avoid and more consistent across individual women with different starting body compositions.
When during perimenopause visceral fat accumulation accelerates most
Visceral fat does not accrue at a constant pace across the years of perimenopause. It accelerates sharply within a defined window that begins before a woman's final menstrual period. Roughly two years before that final period, the rate of fat mass gain approximately doubles, and lean mass starts to decline at the same time, a combination that continues into the early postmenopausal years and runs independently of chronologic age.
The steepest accrual of visceral fat happens during late perimenopause and in the two years following the final menstrual period, after which the rate tends to plateau. But a plateau is not a reversal. Imaging data from the SWAN study show abdominal visceral fat rising 44% across the full menopause transition, and waist circumference and visceral fat often keep climbing into the following decade if nothing intervenes.
Where does a woman locate herself in this timeline? The STRAW+10 framework offers one answer, staging reproductive aging using menstrual cycle characteristics and FSH levels anchored to the final menstrual period. Late perimenopause, labeled Stage -1 under this framework, is marked by a prolonged stretch without a period and an FSH level above 25 IU/mL, and this stage lines up with the steepest metabolic shift of the whole transition.
In early perimenopause, ovulation may still occur monthly, and progesterone tends to fall first while estrogen holds steady or even rises for a time. Only later does estrogen begin to swing erratically and then decline. Because estrogen had further to fall by the time it starts dropping in earnest, the decline can feel abrupt, and the fat-redistribution effects described in the previous section can begin taking hold before estrogen has reached what would be considered a low level. The redistribution is not confined to the abdomen either. Fat also builds up around the heart, inside the liver, and inside muscle tissue during this same window, and this pattern is called ectopic fat deposition.
What Visceral Fat Does Once It Has Accumulated
Visceral fat does not sit inertly once it has formed. It behaves like an active organ, releasing substances that drive insulin resistance, inflammation, and cardiovascular risk. At the center of this process is an elevated rate of lipolysis within visceral fat, the breakdown of stored fat into free fatty acids that circulate through the bloodstream. These free fatty acids flow into the liver in greater volume, and that flux builds up lipid metabolites, which then drive hepatic insulin resistance.
The effects on blood lipids follow a pattern that differs from ordinary aging. Total cholesterol, LDL, and triglycerides climb fastest in the years clustered around the final menstrual period. Data from the SWAN study also suggest that HDL, the cholesterol type usually called protective, loses some of that protective function during perimenopause even when it measures normal. A standard lipid panel reports how much HDL is present rather than whether it still works the way it should, so this functional decline goes unflagged on routine labs.
Insulin resistance follows a similar pattern of hidden progression. Fasting insulin rises years before fasting glucose crosses into abnormal territory, so by the time a glucose test flags a problem, the underlying metabolic damage has already been accumulating for some time. That timing gap makes fasting insulin a more sensitive early warning than fasting glucose, though it is rarely ordered as a routine screen. Sex hormone-binding globulin, or SHBG, offers another angle on the same process. SHBG levels move inversely with intra-abdominal fat and inversely with the risk of type 2 diabetes, an association mediated through visceral fat and liver fat content. Tracking SHBG alongside estradiol and FSH adds a layer of metabolic context that a standard hormone panel cannot provide on its own.
The clinical consequence of this cascade is measurable at a population level. Cardiovascular risk in women begins climbing in the fifth decade of life, roughly ten years behind the equivalent rise in men, and that lag lines up almost exactly with the timing of the menopause transition, a connection now documented in the 2026 American Journal of Preventive Cardiology review. What makes this cascade dangerous is precisely that it can be underway before any standard test, a glucose reading, a lipid panel, a scale, shows anything out of range. That blind spot is what makes the next section's argument necessary.
Why standard weight-management advice fails during this transition
Plenty of women reach perimenopause having spent decades successfully managing their weight through familiar tools: calorie tracking, cardio, cutting carbs. Then, seemingly overnight, those same tools stop working, and the frustration that follows comes from a mismatch between the tool and the problem, because the biological situation has changed underneath the woman using it.
Programs built around scale weight treat every pound you lose as the same as every other pound. But a woman following such a program might lose scale weight while losing lean mass at the same time, with no meaningful reduction in visceral fat at all. On paper that looks like progress. In practice it represents an unfavorable shift in body composition, trading muscle for a lighter number on the scale while the metabolically active fat around her organs stays put. Losing lean mass during weight loss is the default outcome, not an edge case.
Why does lean mass matter so much here specifically? Muscle tissue drives your resting metabolic rate, the energy you burn just existing. Losing muscle on top of the metabolic slowdown already caused by hormonal change compounds the problem rather than offsetting it. If you don't get enough protein and don't do resistance training to signal the body to hold onto muscle, lean mass erodes right alongside fat during almost any weight-loss attempt made during this window.
Biology is not the only force working against standard advice. Sleep disruption, elevated stress, and shifting mood are common features of perimenopause, and they erode the behavioral discipline that self-directed weight programs depend on. Self-regulation demands the most exactly when hormonal disruption makes it hardest to sustain, which is a cruel kind of timing rather than a personal shortcoming.
What should a woman actually track if the scale cannot be trusted? Visceral fat level, lean mass retention, muscle health, and insulin sensitivity are the markers that reflect real metabolic progress during this transition, not total body weight. A woman watching only her scale might conclude a program is working while her underlying metabolic trajectory quietly worsens.
None of this means diet and exercise stop mattering. They remain central. What changes is the type of exercise that counts, resistance training aimed at preserving muscle rather than cardio alone, the amount of protein required, and the actual target worth chasing, which is visceral fat reduction rather than a smaller number on the scale.
Why the scale is the wrong tool and what hormone data actually shows
If visceral fat can expand without the scale moving, then any monitoring plan built on weight and BMI will miss the shift entirely in a large share of perimenopausal women. Hormone data fills that gap, offering a way to see a process that body weight alone cannot reveal.
Estradiol testing carries a built-in complication: there is no fixed "normal range" for estradiol during perimenopause, because levels do not decline in a straight line. They swing unpredictably from one cycle to the next. A single measurement can mislead in either direction, reading falsely high or falsely low depending on where a woman happens to be in that particular cycle.
FSH offers a more stable staging marker, but it still needs context. The European Society of Endocrinology specifies that an FSH reading above 25 IU/L, taken in the early follicular phase or in a woman with absent or irregular periods, strongly suggests perimenopause. FSH should not stand alone, though, since it does not capture the full hormonal picture by itself, and it needs to be measured at day 2 to 5 of the cycle, or after a long enough stretch without a period, to be interpreted correctly. Hormonal contraception, whether a pill or an IUD, can distort FSH readings further, adding another layer of interpretive difficulty to a single test.
That raises an important question: if one test cannot be trusted, what can? The answer lies in tracking over time rather than in any single snapshot. The pattern of estradiol variability across cycles, the direction FSH is trending, the relationship between SHBG and visceral fat buildup, and the early climb in fasting insulin before glucose abnormalities appear all signal where a woman's body is heading. Reading them correctly requires data collected across time rather than a single draw.
A panel built for this purpose typically includes estradiol, progesterone, testosterone, FSH, LH, DHEA-S, AMH, and SHBG, each contributing a different piece of information about reproductive status, metabolic function, and the androgen-excess mechanism described earlier in this piece. Testing is not something every woman needs reflexively. The ESE's 2025 guideline states that biochemical testing is not routinely necessary for diagnosis or management in women over 45, though it is reasonable to consider between ages 40 and 45, and it is recommended when premature ovarian insufficiency is suspected in women under 40. So testing decisions should follow clinical reasoning, not routine habit.
The Diagnostic Tangle That Delays Recognition
Even once the mechanism is understood, a practical obstacle remains: the symptoms of perimenopausal metabolic change overlap so heavily with other conditions that distinguishing them without lab data is genuinely hard, and the woman experiencing them is often the one left absorbing that ambiguity when a clinician tells her everything looks fine.
The overlap with thyroid dysfunction, particularly hypothyroidism, poses the greatest risk of misdiagnosis. Thyroid dysfunction can mimic nearly the entire symptom profile of perimenopause, with fatigue, weight changes, brain fog, mood swings, dry skin, hair thinning, and trouble regulating body temperature appearing in both conditions. TSH testing belongs alongside any core hormone panel.
A second overlap complicates things further. Sleep disruption, fatigue, trouble concentrating, and irritability, all common during perimenopause, are also hallmark features of depression and anxiety. The same cluster of symptoms gets attributed, depending on who is doing the attributing, to menopause, to a mood disorder, to stress, or to a vaguer somatic complaint, and this confusion leads to real diagnostic misses.
What cuts through this tangle is data gathered deliberately rather than symptoms interpreted in isolation: a panel that pairs thyroid markers with reproductive hormones, tracked over time rather than captured in one draw, read alongside the metabolic markers described earlier in this piece, fasting insulin, SHBG, lipid patterns. No single test resolves the ambiguity on its own. Together, tracked across months rather than guessed at from a single visit, they give a woman and her clinician something sturdier to work from than a symptom checklist and a scale that was never built to measure what is actually changing inside her body.
Sources
- Perimenopause as an obesogenic sensitive period: Contributions to elevated cardiovascular risk
- Metabolic Health After 40: What Perimenopause and Menopause Mean for Weight Management
- Increased visceral fat and decreased energy expenditure during the menopausal transition
- The Accumulation of Visceral Fat in Postmenopausal Women: The Combined Impact of Prenatal Genetics, Epigenetics, and Fat Depot Heterogeneity—A Descriptive Review
- nature.com
- health.ucdavis.edu
- academic.oup.com
- Perimenopause Heart Risk: Why Belly Fat Is the Real Problem