Metabolic Blood Panel for Perimenopausal Weight Resistance
Specific blood markers reveal which metabolic disruptions drive perimenopausal weight resistance.
Metabolic Blood Panel for Perimenopausal Weight Resistance.
Why weight resistance in perimenopause is different from ordinary weight gain
Weight resistance during perimenopause is a measurable metabolic phenomenon, not a failure of willpower or arithmetic, and a panel of blood markers can usually explain which of several overlapping disruptions is driving it. The frustrating part isn't the weight itself.
That experience gets waved off constantly, chalked up to aging or "just menopause," as though the label explains the mechanism. The label gets attached without the mechanism it's supposed to explain. What's actually shifting is where fat gets stored, not simply how much of it there is: visceral adipose tissue accumulates during perimenopause even when total body weight barely changes. A woman can step on the scale and see a number she recognizes while her internal chemistry rearranges itself in a direction that raises real metabolic risk.
That distinction matters because visceral fat behaves differently than subcutaneous fat. It sits around the organs, it's metabolically active, and it feeds back into insulin signaling, lipid metabolism, and inflammation in ways that a bathroom scale simply cannot capture. Fatigue, sugar cravings, a stubborn midsection, and a metabolism that feels like it's dragging are nonspecific symptoms that overlap across several conditions. They appear in thyroid disease, in insulin resistance, in adrenal dysfunction, and in the hormonal transition of perimenopause itself, sometimes all at once. Symptoms alone can't tell a clinician, or a patient, which mechanism is actually running the show. Blood work turns a vague, demoralizing symptom into a name, a number, and a plan.
Hormonal changes during perimenopause and their timing
Perimenopause typically starts sometime in the 40s, with a median onset around age 47, though the normal window stretches from the mid-30s into the early 50s BodySpec. Duration is not brief, either.
The hormonal picture is messier than a simple decline. Estrogen doesn't taper off in a smooth line, it swings, sometimes dropping precipitously low and sometimes spiking above what would be considered a normal premenopausal level. Progesterone, meanwhile, tends to drop earlier and more consistently than estrogen, which is often the first hormonal signal, well before hot flashes or irregular cycles become obvious, that the transition has begun.
Layered on top of that are changes in SHBG, the protein that governs how much estrogen and testosterone are actually free to act on tissue, and shifts in cortisol regulation, since estrogen normally helps modulate the stress response. Once estrogen becomes erratic, cortisol tends to follow suit. So what does this add up to? No single hormone tells the whole story here, and because these levels move around so much, a single blood draw is inherently a snapshot of a moving target. That's the case for testing a panel rather than one marker, and for tracking values over time rather than treating one draw as gospel. Duration varies widely, averaging 4 years but potentially lasting up to 10 years, meaning metabolic disruption is not brief Perimenopause: Age, Stages, Signs, Symptoms & Treatment.
How estrogen and FSH together drive visceral fat accumulation
Estrogen's job extends well past reproduction. It suppresses appetite through several distinct pathways in the hypothalamus, and when estrogen signaling through estrogen receptor alpha starts to decline, both appetite regulation and energy expenditure shift in an unfavorable direction. That's one half of the story.
The other half is FSH, and it's the half that tends to get skipped over. Rising FSH is independently associated with increases in visceral fat, separate from whatever estrogen is doing. It's also linked to lower lean body mass, which compounds the problem: less muscle means a lower resting metabolic rate, on top of more visceral fat. One retrospective dataset spanning 2020 to 2026 shows just how dramatic this shift can get by the postmenopausal endpoint, with FSH climbing from 7.46 to 51.47 mIU/mL while estradiol falls from 110.02 to 12.79 pg/mL BodySpec Frontiers in Endocrinology 2026. That's the destination, not the starting point, but the direction of travel is already underway well before a woman reaches it.
So why measure both markers instead of picking one? Because estradiol and FSH aren't telling the same story twice, they're two independent signals about visceral fat risk pulling from different mechanisms. A woman with low estradiol and modestly elevated FSH is in a different metabolic position than one with low estradiol and dramatically elevated FSH, even if her symptoms look identical on paper. Neither number alone settles the question. Together, they start to.
The insulin resistance layer: why fasting glucose misses what fasting insulin reveals
This is where a lot of women get failed by the standard lab panel. Insulin resistance can develop years, sometimes closer to a decade, before fasting glucose or HbA1c actually cross into abnormal territory. Someone can be told her labs look "normal" while she's already metabolically compromised. Dr. Mary Claire Haver, writing in June 2026, described exactly this pattern: perimenopausal women running high insulin while glucose still looks fine, with the consequences appearing as weight that won't budge, energy crashes, sugar cravings, and unexplained fatty liver.
Why does insulin climb before glucose does? Expanding visceral fat increases the flow of free fatty acids to the liver, which drives hepatic insulin resistance, and the body compensates by pumping out more insulin to keep glucose in range. That compensation works, for a while, and glucose can look fine on paper even as the underlying resistance deepens. And insulin actively drives this process. It's a storage hormone, so elevated levels actively promote abdominal fat retention regardless of what's happening with calorie intake. Declining estrogen makes this worse still, since estrogen normally has insulin-sensitizing effects, and losing that protection means tissue-level insulin sensitivity takes a hit right when visceral fat is already climbing.
The marker set that actually catches this early is fasting insulin, fasting glucose, and HbA1c, read together. Fasting insulin is the early warning; glucose and HbA1c confirm how far things have progressed. Fasting insulin on its own, without glucose as context, can actually mislead in either direction, so the three work as a set rather than as substitutes for one another. This cluster, more than almost any other in the panel, tends to explain why eating less and moving more stopped working.
What thyroid markers add to the picture
Hypothyroidism and perimenopause overlap almost symptom for symptom: fatigue, weight gain, feeling cold, mood swings, brain fog, irregular cycles. Women develop thyroid disorders at meaningfully higher rates than men do, and the perimenopausal years appear to be a period of particular vulnerability for the thyroid gland.
TSH is the test most clinicians reach for first, and it's also the one that most often gives a false sense of reassurance. TSH can sit comfortably in range while free T3 or free T4 is suboptimal, so a woman can have real, tissue-level hypothyroidism even though the headline number looks normal. Antithyroperoxidase antibodies add another layer entirely: they flag autoimmune thyroid disease, Hashimoto's, which can be quietly present for years before TSH ever drifts out of range. Dr. Kathleen Mahannah's integrative perimenopause protocol reflects this directly, calling for TSH, free T4, free T3, and ATPO together rather than TSH in isolation.
Missing this distinction has real consequences in both directions. Treating weight resistance with lifestyle changes or hormone support alone leaves an undiagnosed thyroid problem, whether the primary driver or a co-driver, free to keep the needle from moving. Flip it around: attributing everything to the thyroid while missing the hormonal transition causes women to be treated for thyroid disease with no explanation for whatever symptoms persist afterward. Running thyroid and reproductive hormone markers in the same draw removes the guesswork, since it lets one see whether one system, the other, or both are contributing to what she's experiencing.
Cortisol, DHEA, and the stress-metabolism loop that perimenopause accelerates
Estrogen normally has a hand in regulating cortisol secretion, and when estrogen turns erratic, cortisol regulation tends to deteriorate right along with it. Chronically elevated cortisol promotes abdominal fat deposition, raises blood sugar, increases appetite, and suppresses metabolic rate, stacking directly on top of the visceral fat gains already underway from shifting FSH and estrogen. It's a compounding burden that stacks directly onto the same problem.
A feedback loop runs through here, too. Perimenopause disrupts sleep through night sweats and general hormonal turbulence, poor sleep elevates cortisol the following day, and elevated cortisol makes the original disruption worse. Each piece feeds the next.
DHEA belongs in this conversation because it's a precursor hormone that the body converts into both estrogen and testosterone downstream, and its levels decline with age, often ending up quite low by the time a woman is well into perimenopause. Low DHEA causes fatigue, reduced lean mass, and diminished resilience to stress, visible enough that it can be mistaken for depression or plain burnout if nobody thinks to check the underlying number. A cortisol-to-DHEA ratio, taken together, paints a fuller picture of adrenal function than either number could alone. When weight resistance, fatigue, and mood symptoms persist even after hormonal and thyroid pieces have been addressed, the adrenal axis is usually the next place to look, and it's measurable rather than a matter of guesswork. DHEA testing is relevant here because it contextualizes the adrenal contribution to overall androgen and estrogen availability, and because DHEA supplementation is a clinical option that requires knowing baseline levels first.
Testosterone, SHBG, and lean mass: the androgen piece that affects body composition directly
Testosterone in women declines gradually starting around age 30, well before perimenopause even begins. But as estrogen drops during the transition, the ratio between testosterone and estrogen shifts, producing a state that looks like relative hyperandrogenemia even while absolute androgen levels are falling. That's a strange thing to sit with: androgens are dropping in absolute terms, yet relative to estrogen, they're more dominant than before.
It gets genuinely counterintuitive here. Total testosterone can look perfectly adequate on a lab report while free testosterone, the fraction that's actually biologically active, is low, because SHBG moves independently and determines how much hormone is actually available to tissue. The number that matters clinically is the Free Androgen Index, calculated from total testosterone and SHBG together, not total testosterone sitting alone on a page. Low free testosterone tracks with reduced lean muscle mass, a lower resting metabolic rate, fatigue, and a blunted response to exercise, all of which make weight resistance considerably harder to push through.
SHBG deserves attention in its own right, because when it runs high, it suppresses free hormone availability across the board, binding up both estrogen and testosterone at once, which makes it one of the most important interpretive variables in the entire panel. It also isn't independent of the insulin story covered earlier: hyperinsulinemia suppresses SHBG, which then raises free androgen activity, another thread connecting the insulin resistance layer to the androgen layer. Two women can post identical total testosterone numbers and land in completely different places body-composition-wise, purely because their SHBG differs, so the free calculation, not the total, is the number worth trusting.
Lipids and cardiovascular markers in perimenopause
Estrogen has genuinely favorable effects on lipid metabolism, and as it declines, LDL tends to climb, HDL can drop, and triglycerides often rise, sometimes fairly quickly and without any change in diet. Visceral fat, already established as a defining feature of this transition, compounds the problem directly by increasing free fatty acid flow to the liver.
For women already on or weighing hormone therapy, the type of progestogen used actually matters to this picture. A 2025 systematic review and meta-analysis covering 17 randomized controlled trials found that synthetic progestogens, MPA in particular, blunt estrogen's favorable effects on lipids and insulin sensitivity more than micronized progesterone does. That's not a minor footnote, for it's a meaningful variable in how the metabolic picture evolves under treatment.
The standard lipid panel, total cholesterol, LDL, HDL, and triglycerides, remains the baseline for cardiovascular risk assessment, and it should be part of any comprehensive workup. For women carrying a family history of cardiovascular disease, Dr. Mahannah's protocol adds lipoprotein A and apolipoprotein B, both of which predict atherosclerotic risk more precisely than standard LDL in certain populations. None of this is cosmetic. These are measurable downstream consequences of the same hormonal shift driving the weight resistance, and catching them early creates room to intervene before cardiovascular risk has a chance to compound.
How to read the panel as a whole, not as individual numbers
Persistent weight gain isn't one condition wearing different masks, it's a symptom with several possible dominant drivers, and different women land on different ones. High FSH paired with low estradiol points toward the hormonal route into central fat accumulation Frontiers in Physiology 2022. High fasting insulin with glucose still in normal range points toward insulin resistance running ahead of any glycemic red flag. Low free thyroid hormones point toward a metabolic rate actively suppressed by thyroid dysfunction. Low free testosterone alongside high SHBG points toward lean mass loss.
A panel that captures all of these at once lets a clinician see which mechanisms are actually active in a given woman, rather than treating the most visible symptom and hoping it's the right target. Patterns carry more weight than any single value in isolation: FSH sitting in the normal range alongside very low estradiol tells a different story than that same FSH paired with mid-range estradiol. The numbers only mean something in relation to each other.
The standard reference range problem also sits alongside this. Those ranges get built from broad population data, and broad population data doesn't necessarily reflect what's optimal for a woman navigating this specific transition, so a result flagged as "normal" can still be functionally underperforming for her. Because hormone levels move so much across a cycle, and even across a single day, one draw is a reference point. The pattern across repeated draws over time is where the real signal lives. None of this replaces a clinician's judgment, either. Data without an expert reading it can't distinguish a passing fluctuation from a sustained shift, or a primary hormonal cause from a downstream metabolic consequence, which is the whole argument for testing that's longitudinal and clinician-reviewed rather than a single at-home snapshot.
What a comprehensive perimenopause metabolic panel looks like in practice
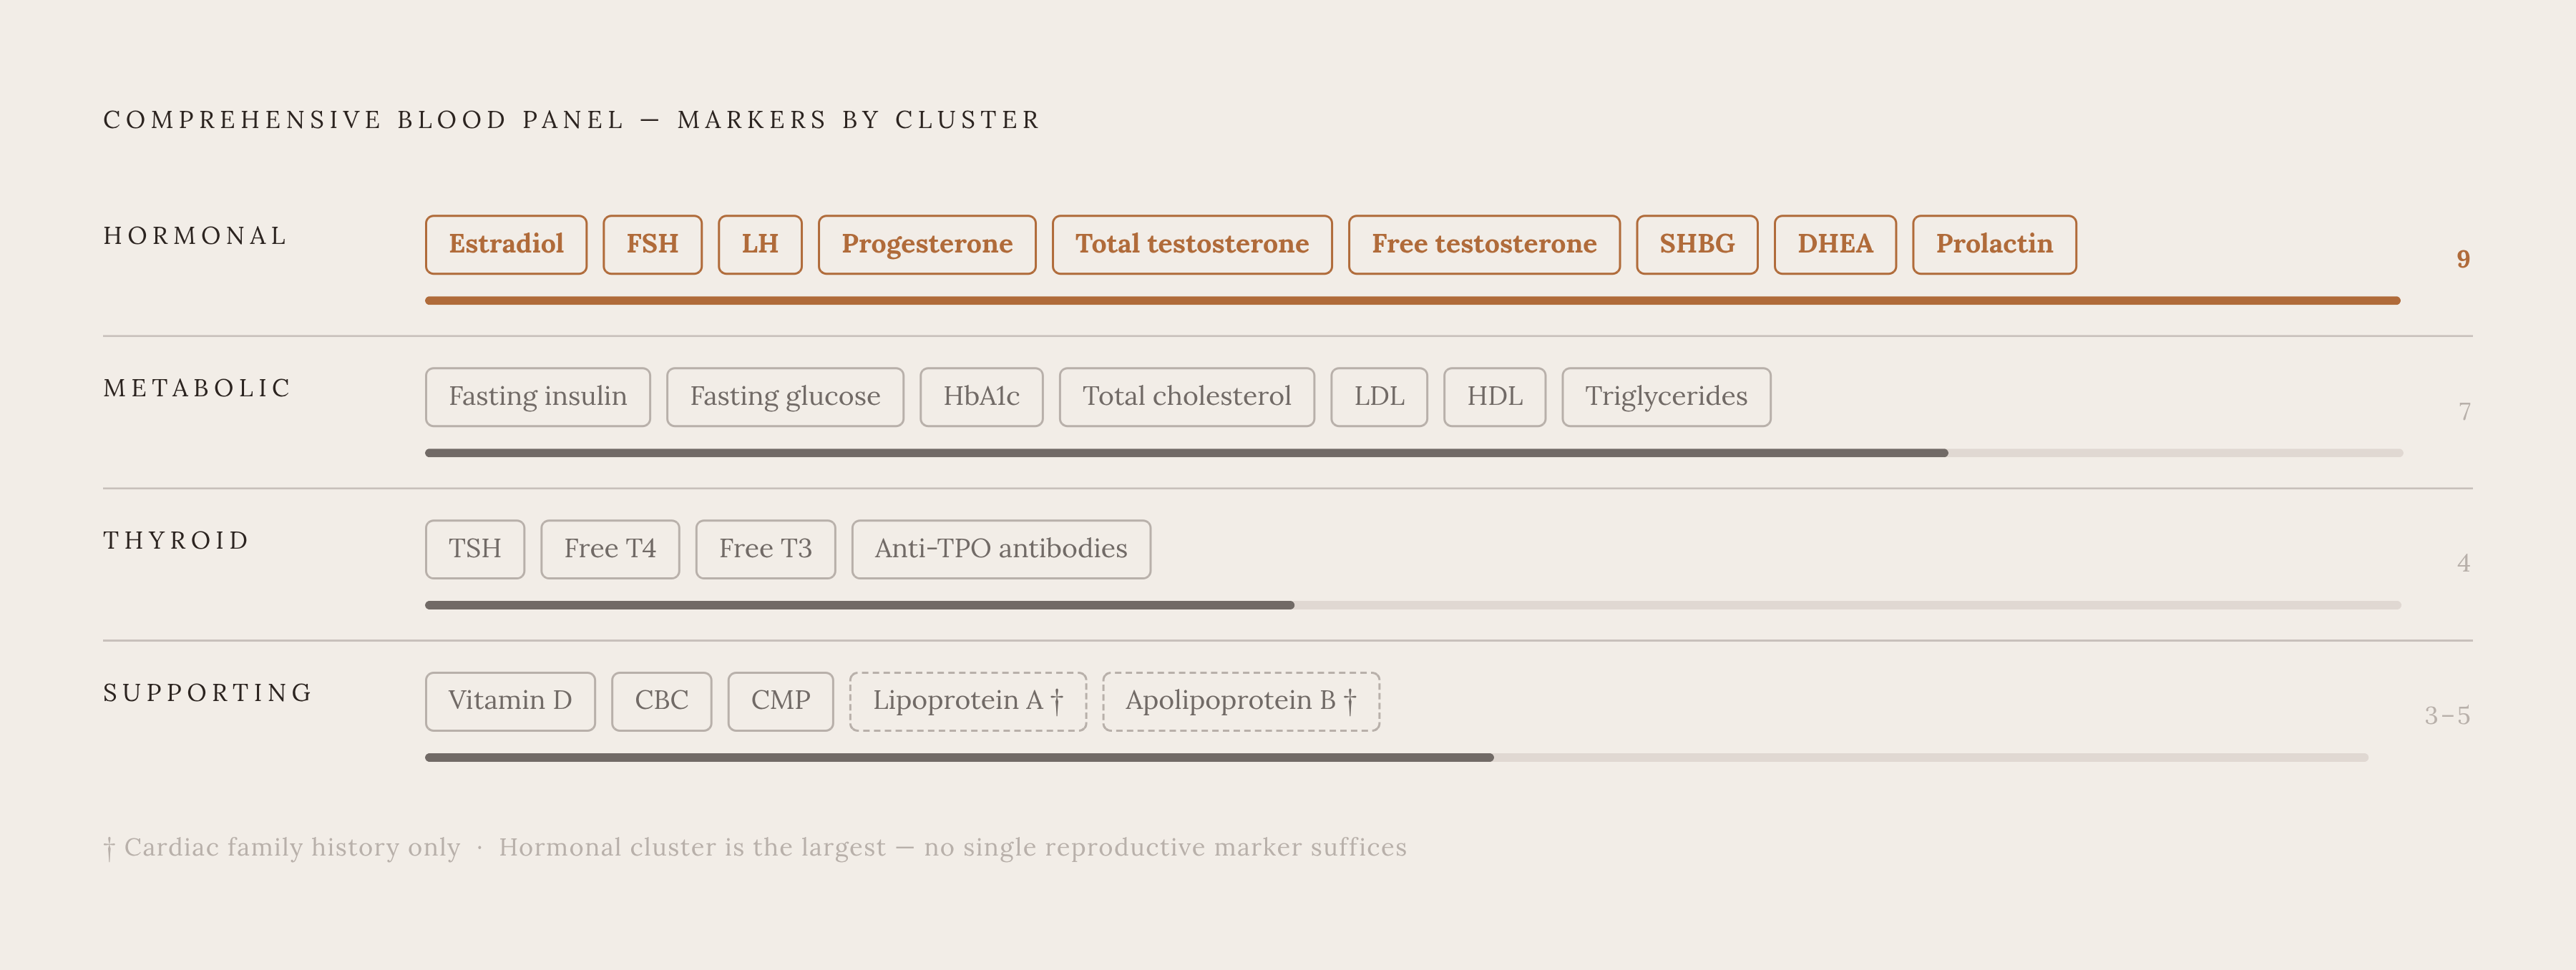
Put together, the panel this piece has been building toward covers several layers at once, deliberately overlapping rather than relying on any single number to carry the diagnosis.
The core hormonal markers are estradiol, FSH, LH, progesterone, total testosterone, free testosterone, SHBG, DHEA, and prolactin. The metabolic layer adds fasting insulin, fasting glucose, HbA1c, and a full lipid panel covering total cholesterol, LDL, HDL, and triglycerides. Thyroid function gets its own cluster: TSH, free T4, free T3, and antithyroperoxidase antibodies. Supporting markers round things out, vitamin D, since deficiency is common in perimenopause and affects mood, immune function, and musculoskeletal health, alongside a CBC and CMP for baseline systemic context. For women with a family history of cardiovascular disease, lipoprotein A and apolipoprotein B are worth adding on top of the standard lipid panel.
None of these markers, read alone, settles the question of why the weight won't move. Read together, tracked over time, and interpreted by someone who understands how estrogen, FSH, insulin, thyroid hormone, cortisol, and androgens all lean on each other, they turn a maddeningly vague symptom into something with actual edges, something that can be named, followed, and acted on.
Sources
- Perimenopause Age: Signs, Timelines & What to Expect | BodySpec
- Perimenopause: Age, Stages, Signs, Symptoms & Treatment
- Perimenopause and Weight Gain: Metabolism Hormone Testing
- Perimenopause as an obesogenic sensitive period: Contributions to elevated cardiovascular risk - PMC
- Frontiers | Metabolic impact of endogenously produced estrogens by adipose tissue in females and males across the lifespan
- Increased visceral fat and decreased energy expenditure during the menopausal transition - PMC
- Clinical review: Menopause hormone therapy in weight management - ScienceDirect
- Cortisol, DHEA-S, and cortisol/DHEA-S ratio in association with oxidative stress in Korean adults